JaredW
2008-01-02 16:40:06 UTC
Q1: There is not a concept of a Digital Chart yet in LabVIEW. However, you can get around this by using a shift register in your while loop, and append the previous waveform with the new waveform, and then plot the new waveform. There is a VI in the Digital Waveform palette for concatanating two waveforms called "Append Digital Samples.vi". This VI only takes a single DWDT, not a 1D Array of DWDTs, so you will need to put it in a for loop that indexes through each element of your 1D arrays. See attached screenshot.
Q2: The dynamic datatype in LabVIEW only supports the various types of Analog Waveforms, not digital waveforms. Also, the only LabVIEW graph that supports digital waveforms at this time is the Digital Waveform Graph. You can get around the histogram issue by following the suggestions made in the Q1 answer.
Q3: I agree that the file read/write functions are confusing with regard to which datatypes they support. Unfortunatly, digital waveforms are not supports by the file I/O VIs you are trying to use (even though the icon has a digital signal on it :smileymad: ). To save the data to a spreadsheet ascii file, you will have to convert the data to a spreadsheet string, and then save that string to file using the standard LabVIEW File I/O VIs. There is not an intuitive way to convert DWDT to ASCII, but there is a simple method to do it. First off, a DWDT is really just a 2d array of 0's and 1's. So fist you should convert your DWDT into a 2D array of U8, where each element represents a signal sample for one signal. Once you have the 2D array of 0's and 1's, you can use a control from the string palette called "convert to spreadsheet string", and pass it the 2D array. I've quickly created an example you can look at to get a reference for how to do this. Your situation is a little harder since you are using a 1D array of DWDTs, so I had to add a for loop that indexes each element (I also asssumed that each element of the 1D array only contains one signal).
Good luck,Jared
Message Edited by JaredW on 01-02-2008 10:22 AM
combineDWDTSamples.JPG:
Loading Image...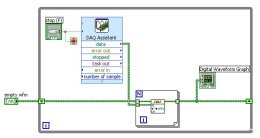
DWDT Array to String2.JPG:
http://forums.ni.com/attachments/ni/70/7967/3/DWDT Array to String2.JPG
Q2: The dynamic datatype in LabVIEW only supports the various types of Analog Waveforms, not digital waveforms. Also, the only LabVIEW graph that supports digital waveforms at this time is the Digital Waveform Graph. You can get around the histogram issue by following the suggestions made in the Q1 answer.
Q3: I agree that the file read/write functions are confusing with regard to which datatypes they support. Unfortunatly, digital waveforms are not supports by the file I/O VIs you are trying to use (even though the icon has a digital signal on it :smileymad: ). To save the data to a spreadsheet ascii file, you will have to convert the data to a spreadsheet string, and then save that string to file using the standard LabVIEW File I/O VIs. There is not an intuitive way to convert DWDT to ASCII, but there is a simple method to do it. First off, a DWDT is really just a 2d array of 0's and 1's. So fist you should convert your DWDT into a 2D array of U8, where each element represents a signal sample for one signal. Once you have the 2D array of 0's and 1's, you can use a control from the string palette called "convert to spreadsheet string", and pass it the 2D array. I've quickly created an example you can look at to get a reference for how to do this. Your situation is a little harder since you are using a 1D array of DWDTs, so I had to add a for loop that indexes each element (I also asssumed that each element of the 1D array only contains one signal).
Good luck,Jared
Message Edited by JaredW on 01-02-2008 10:22 AM
combineDWDTSamples.JPG:
Loading Image...

DWDT Array to String2.JPG:
http://forums.ni.com/attachments/ni/70/7967/3/DWDT Array to String2.JPG


